Model performance
Model Fit, Bias and Variance
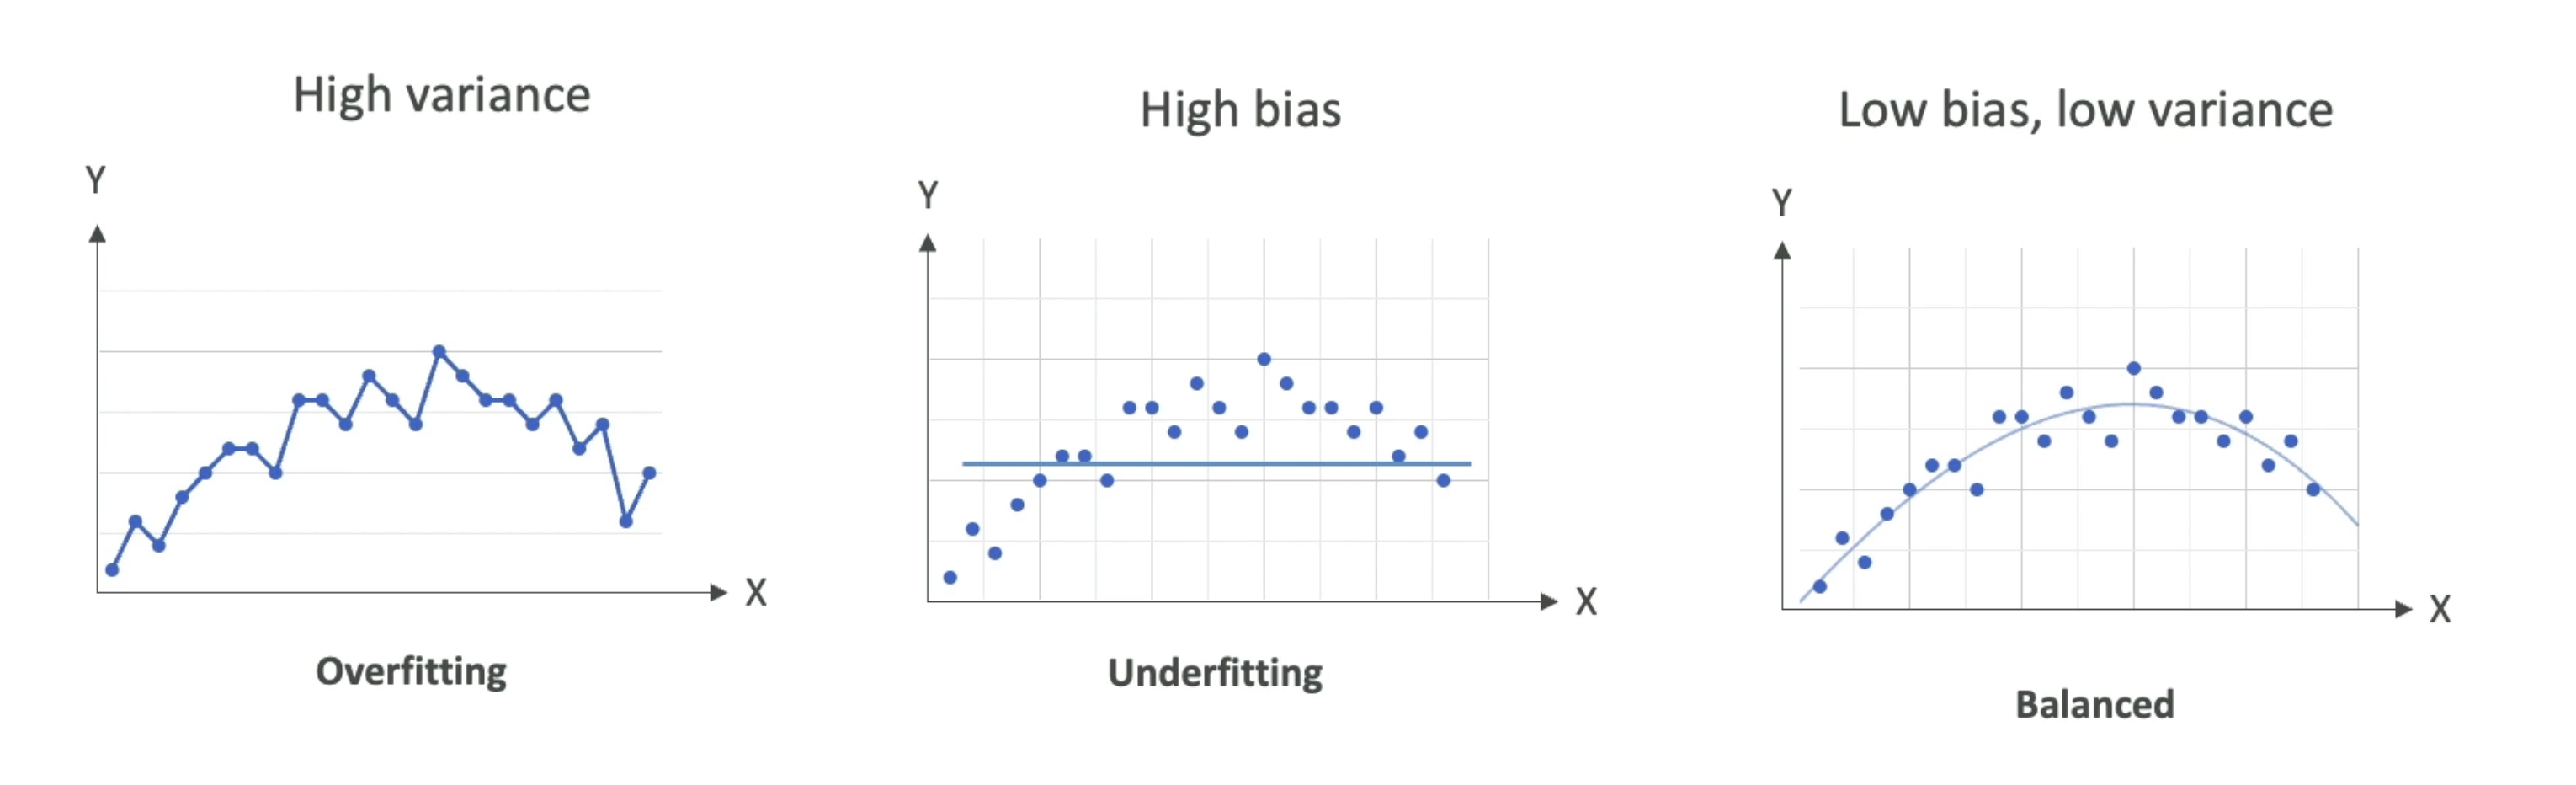
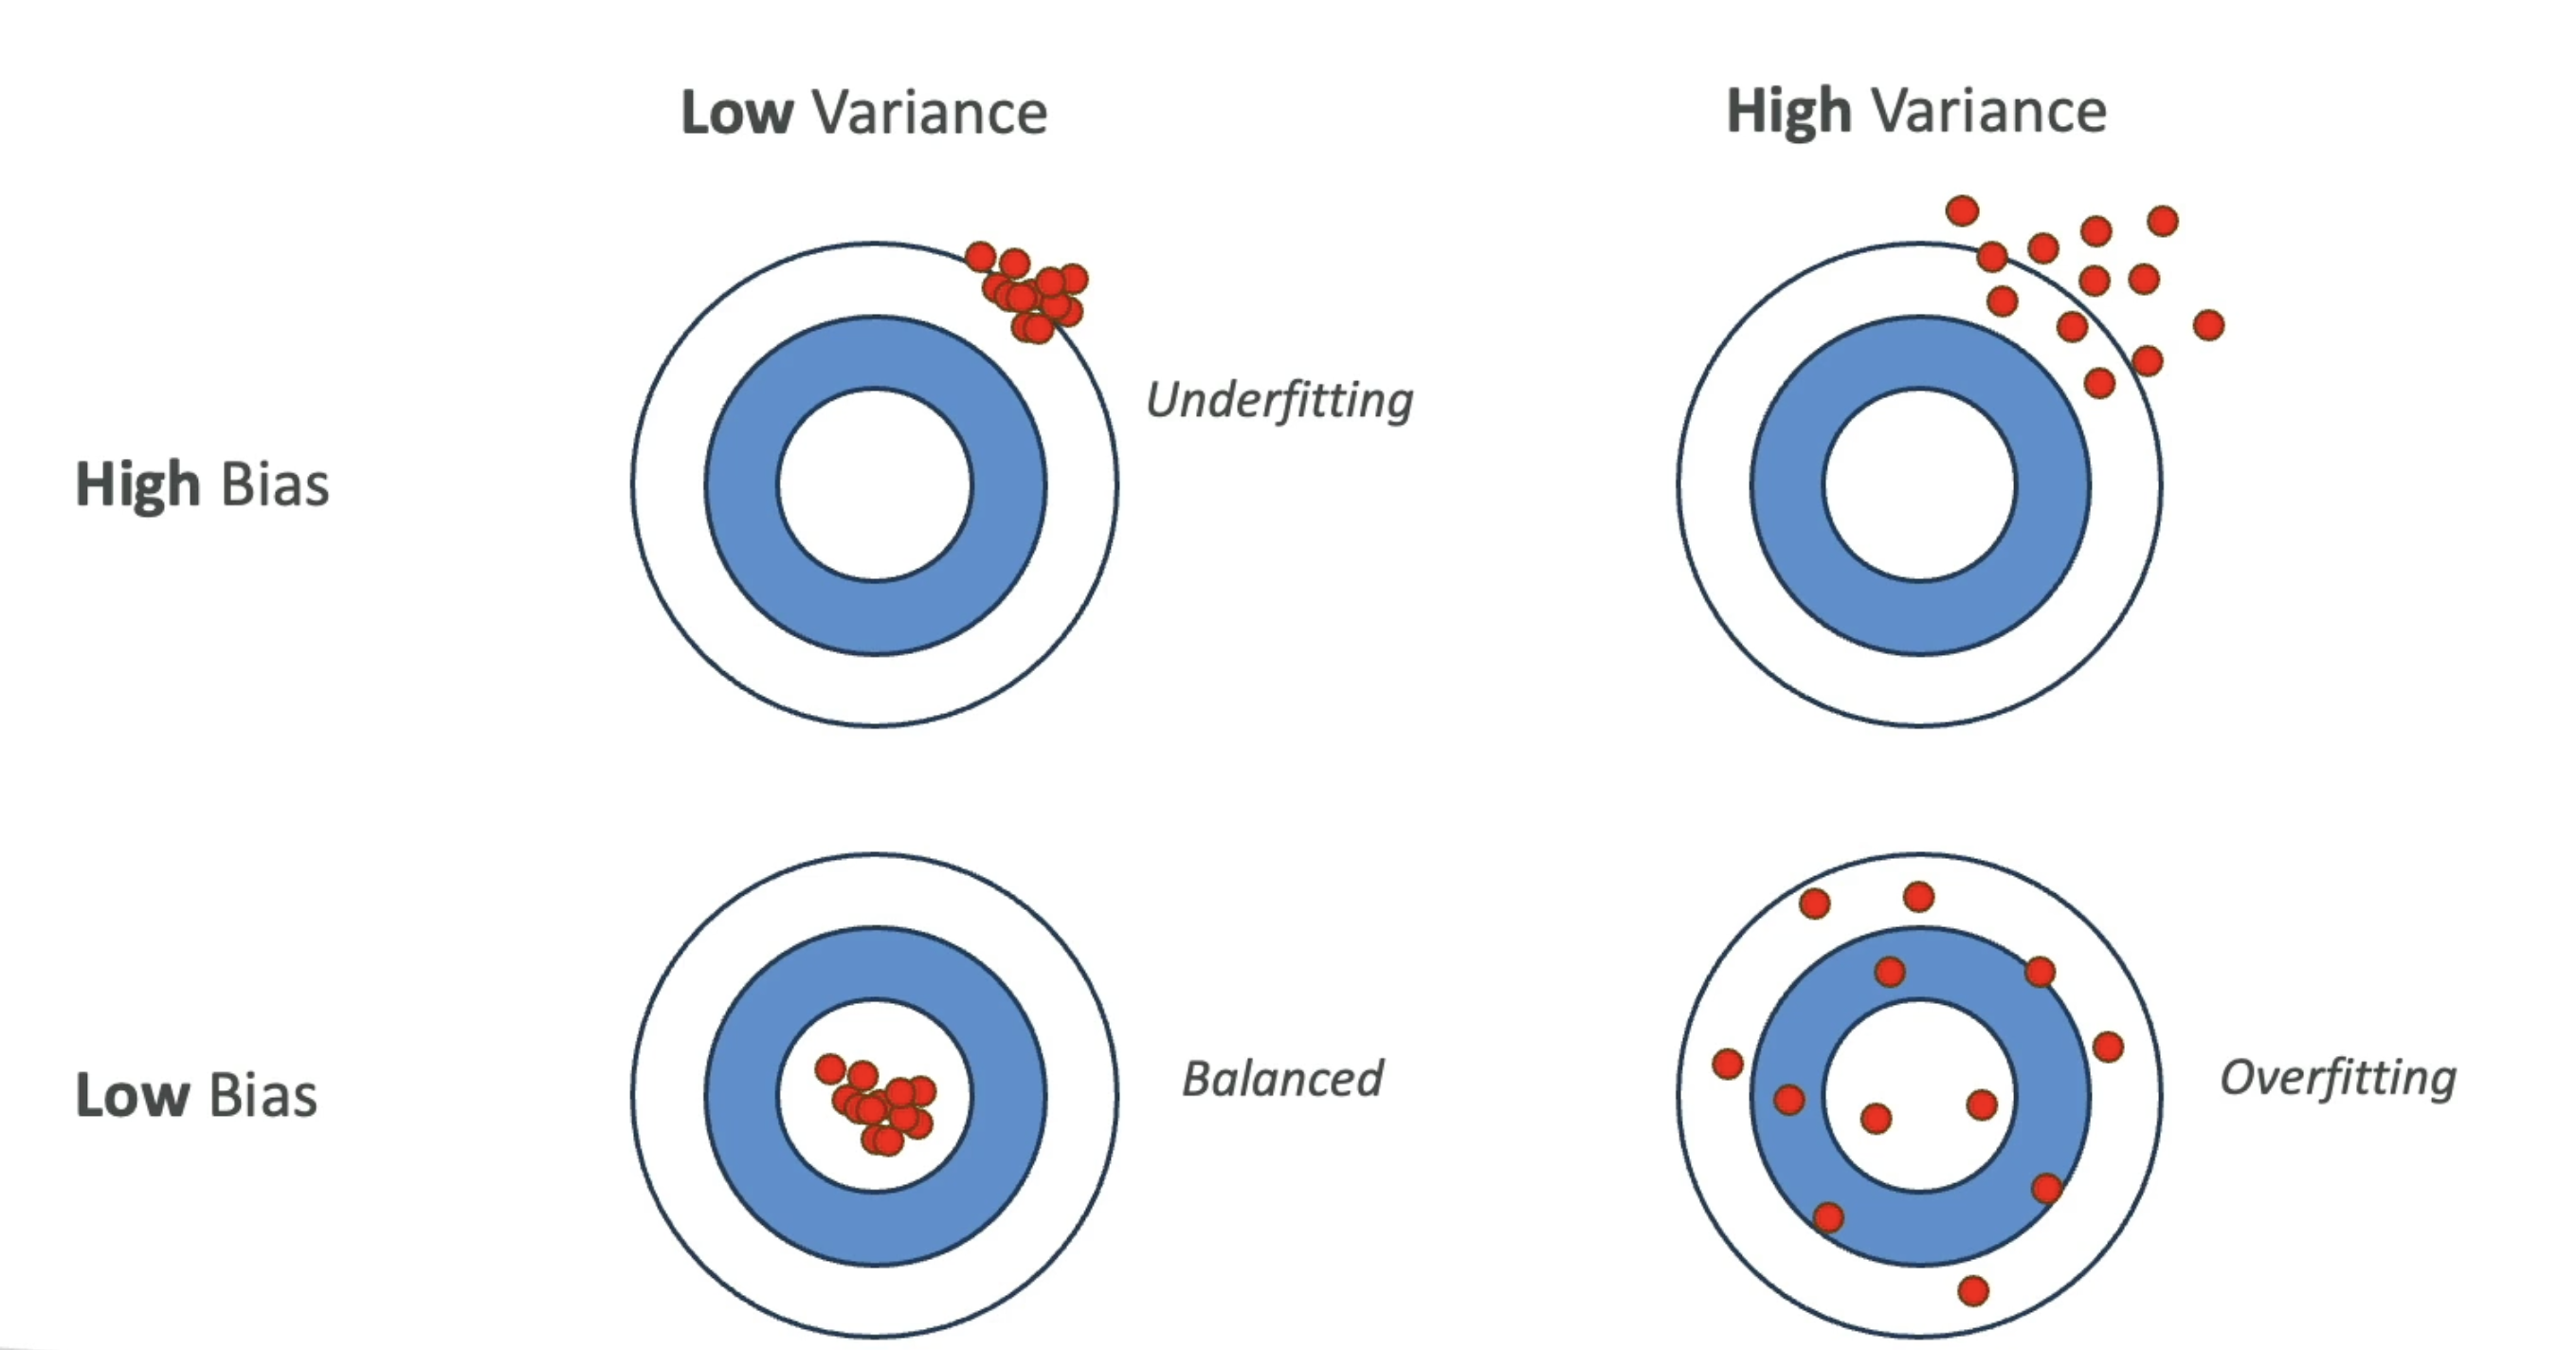
- Model Fit
Overfitting: models performs well on the training data, but not on the evaluation data- Reasons: training data size too small, model trained for too long on a single sample set of data, model complexity is too high (learns from noise)
Underfitting: model performs poorly on the training data-
Balanced: neither overfitting or underfitting -
Bias
- Difference between predicted and actual value
- High bias is bad! E.g., linear regression for a non-linear dataset
-
Reduce bias by increasing the number of features
-
Variance
- How much the performance of the model changes if trained on a different dataset which has a similar distribution
- Reduce variance by feature selection (less, more important features)
Model Evaluation Metrics
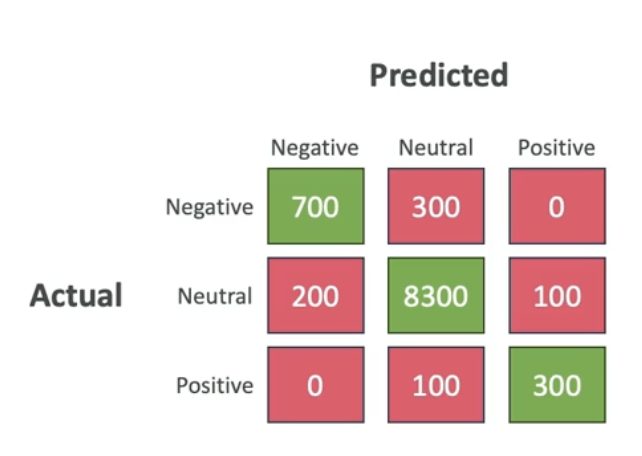
Binary Classification
- E.g., spam/not spam
- It's evaluated with a
confusion matrix - True positives (TP), True negatives (TN), False positives (FP), False negatives (FN)
- In an
imbalanced datasetFP and FN have different weights (e.g., a FN spam is much worse than FP spam)
$$Precision = \frac{TP}{TP+FP}$$
$$Recall = \frac{TP}{TP+FN}$$
$$F1 = \frac{T2PrecisionRecall}{Precision+Recall}$$
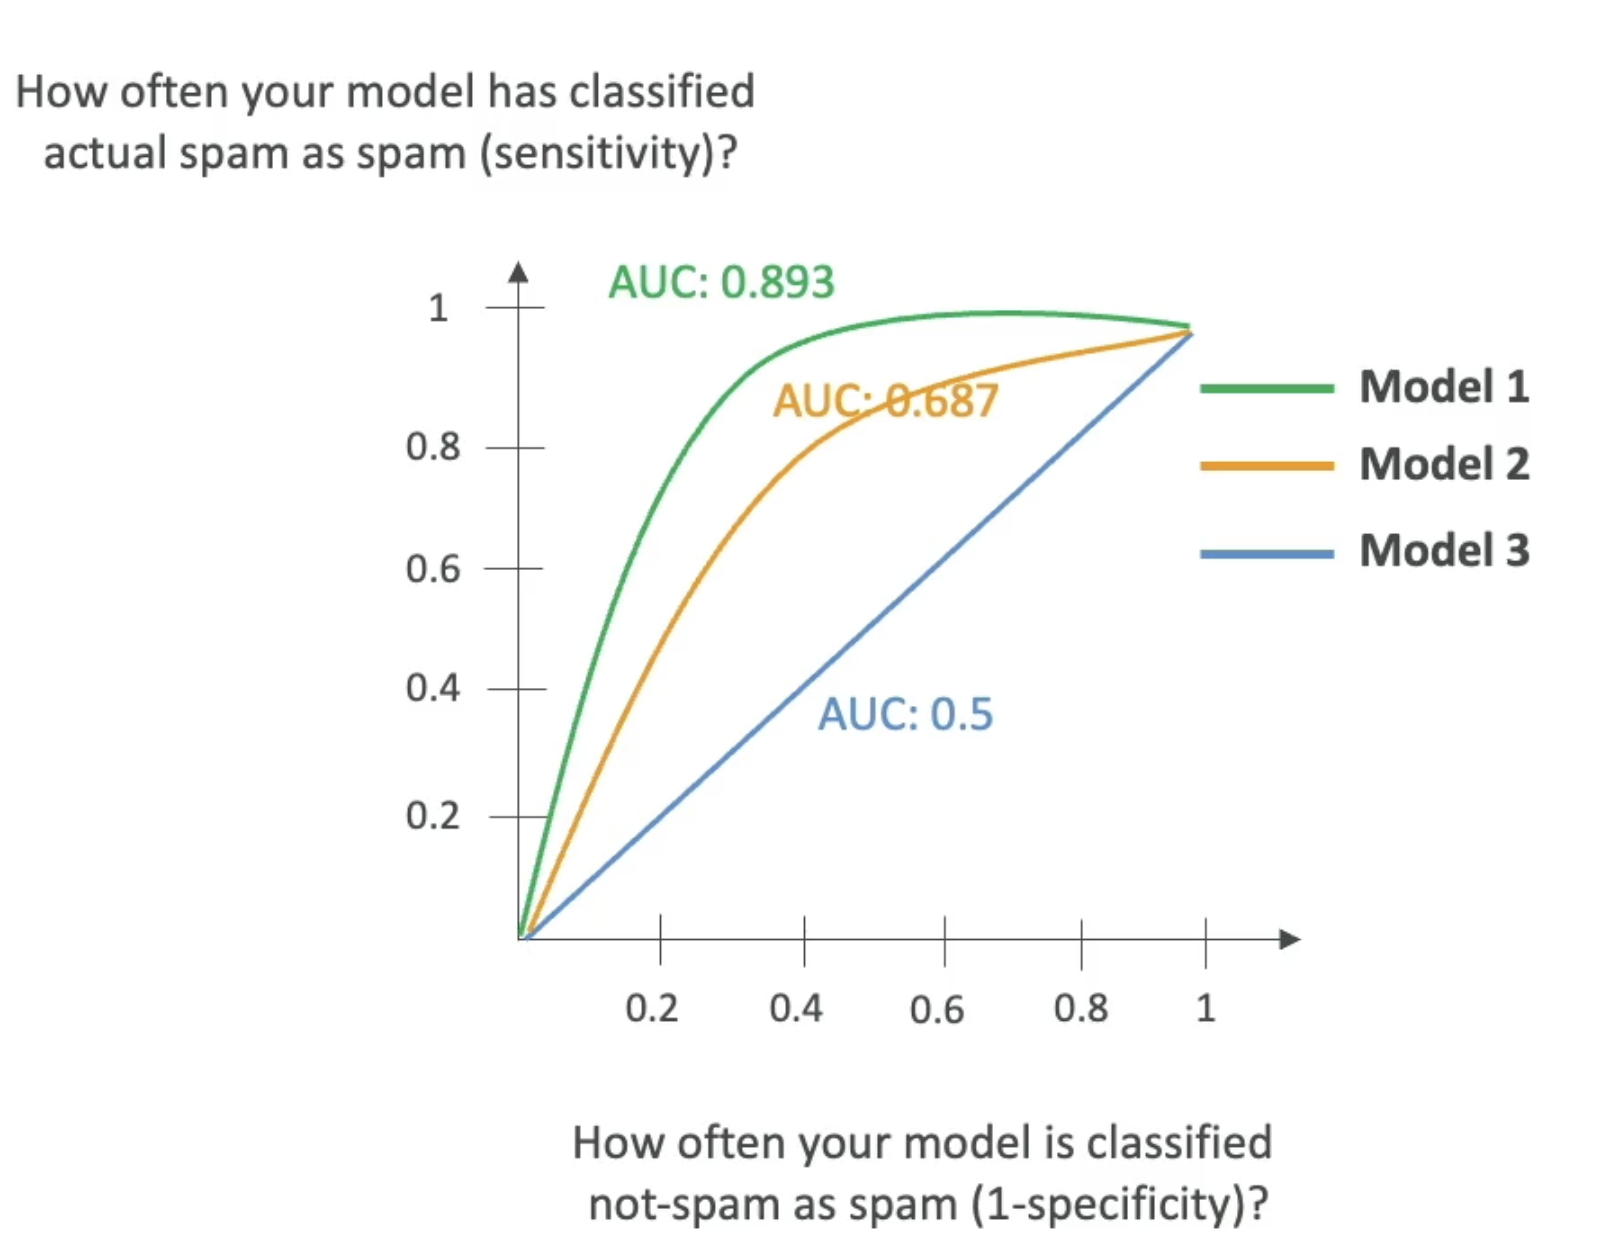
AUC-ROC
Area Under Curve-Receiver Operator Curve- Value from 0 to 1 (1 is perfect model)
- Uses
sensitivity(TP rate) andI-specificity(FP rate) - AUC-ROC shows what the curve for TP compared to FP looks like at various thresholds
Regression Metrics
These are metrics used for evaluating models that predict a continuous value
MAE: Mean Absolute Error- Between predicted and actual values
$$MAE = \frac{1}{n} \displaystyle \sum_{i=1}^n |y_i - \overline{y_i}|$$
MAPE: Mean Absolute Percentage Error
$$MAPE = \frac{1}{n} \displaystyle \sum_{i=1}^n |\frac{y_i - \overline{y_i}}{\overline{y_i}}|$$
RMSE: Root mean squared error
$$RMSE = \sqrt{\displaystyle \sum_{i=1}^n \frac{(\overline{y_i} - y_i)^2}{n}}$$
R Squared- Explains variance in your model
- $Rˆ2$ close to 1 means predictions are good