Prometheus
- Launched by SoundCloud in 2012
- The de facto
standard data model for metrics - It's a
time-series database (TSDB)+ ascraper+ aquery language, all in one binary - Uses a pull-model (scraping)
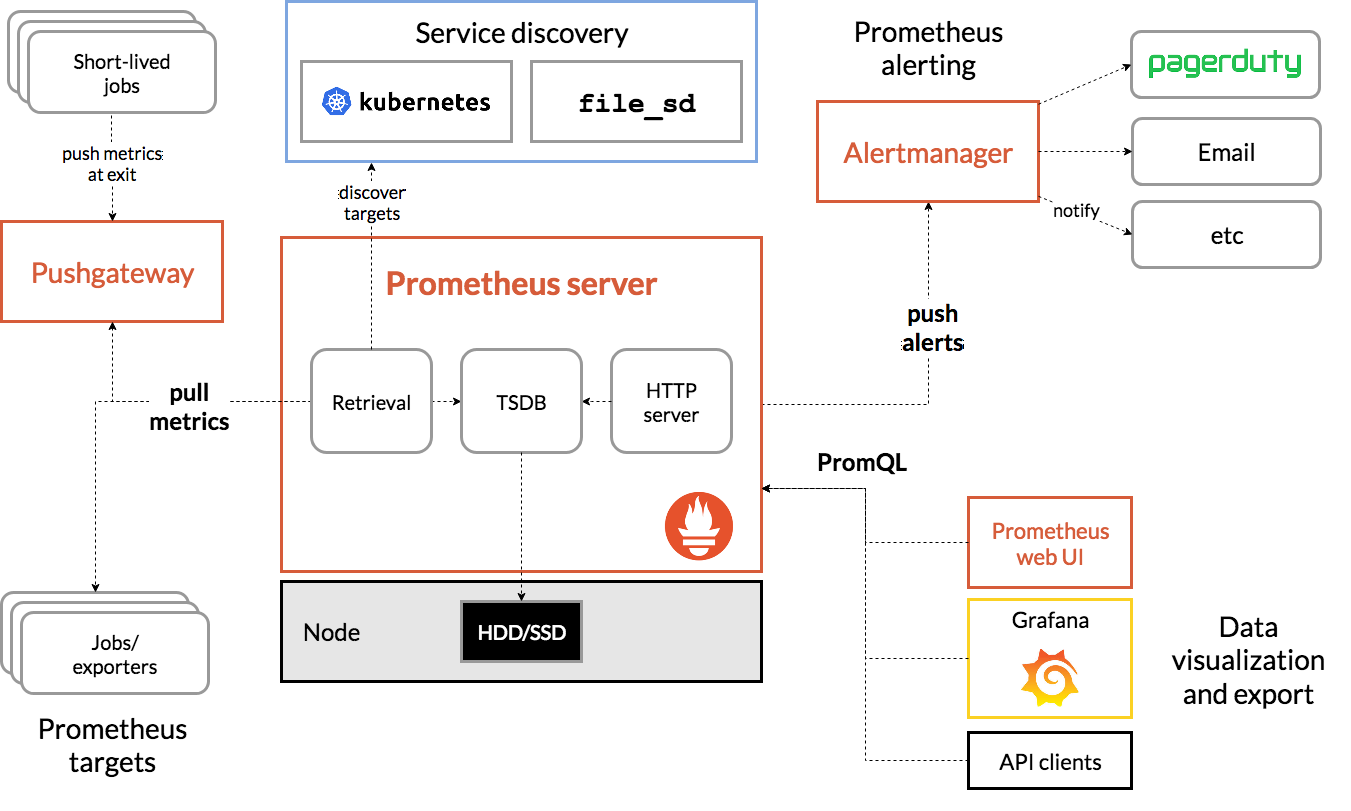
Components
- Retrieval
- Worker that pulls the metrics data
- Pulls from HTTP endpoints
- Default endpoint for the service:
{host}/metrics - The target must
exposethis /metrics route - The metrics must be exposed in the correct format
- For services that do not expose /metrics by default it needs an
exporter(to format and expose the metrics) -
For
short-lived jobsthe application push then into apushgatewayand prometheus scrapes from the pushgateway -
Storage
- Prometheus is deliberately simples about storage
- A single prometheus server
- Stores data on local disk (not clustered, not replicated)
- Keeps it for a limited retention (default 15 days)
- Can also integrate with
Remote Storage Systems
- Can also integrate with
- Scales up but NOT out
-
Due to these metrics, other solutions are used for TSDB (e.g., vicmetrics)
-
HTTP server
- Accept
PromSQLqueries to consult the storage - Prometheus exposes its own
/metricsendpoint